HoloLens–The Path to 60fps
In mixed and virtual reality display technologies in order to not break the illusion of ‘presence’ it is critical to honour the time budget from device movement to getting the image to hit the users retina. This latency budget is known as ‘motion to photon’ latency and is often cited as having an upper bound of 20ms which, when exceeded will cause the feeling of immersion to be lost and digital content will noticeably lag behind the real world. With that in mind making performance optimisations a central tenet in your software process for these kinds of apps will help to ensure that you don’t ‘paint yourself into a corner’ and end up with a lot of restructuring work later.
I recall witnessing tests of audio latency using a keyboard and MIDI over Wifi and discovering not unsurprisingly that musicians have a much lower tolerance for the perception of the latency measured from when a keyboard key is pressed until the resulting sound is processed by their brain as having been heard so its also worth keeping in mind that human tolerances to latency and performance will vary.
I have been involved in a couple of small projects recently for HoloLens and have picked up a few tips and techniques for performance optimisation which I’d like to discuss and share here (first read Performance recommendations for Unity and Performance recommendations )
Tools
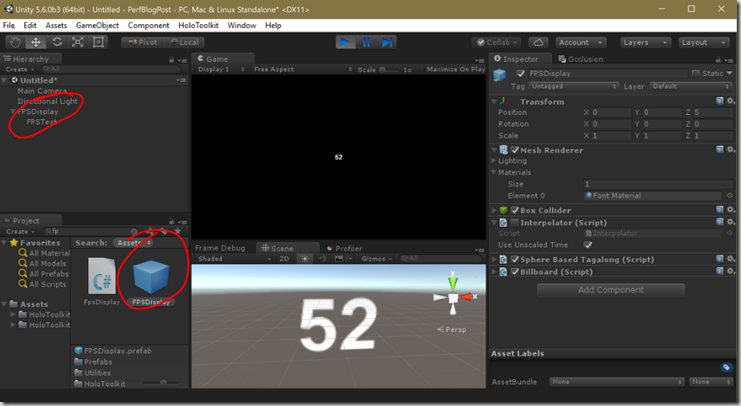
Firstly, it’s a good idea to have performance metrics as visible as possible and having an FPS counter on display at all times will help catch those times when changes have inadvertently resulted in performance degradation in some way. The HoloToolkit for Unity has a prefab which can simply be dragged into your scene
This will display the frame rate averaged over 60 frames visible in your view at all time.
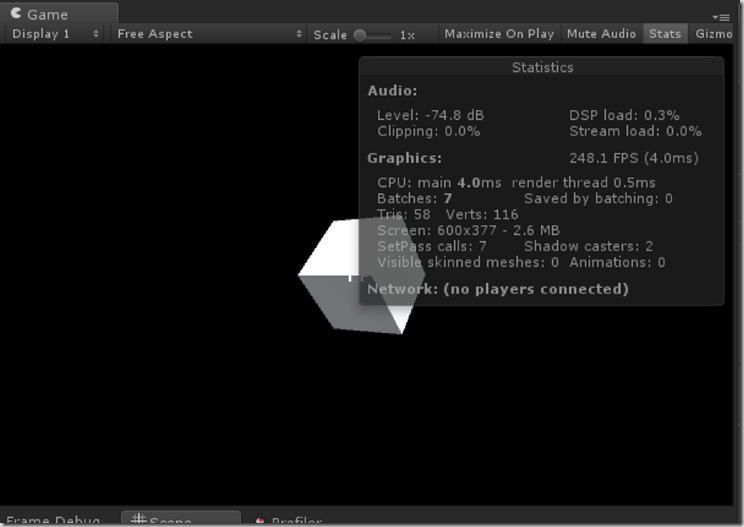
The Unity game preview window has an option to show stats which shows some useful info such as how many faces are currently being rendered in the view and how many draw calls are taking place, etc.
For more in-depth information we can turn to either the Unity profile window or the Visual Studio graphics debugger – let’s take a look at both. The general questions we seek to answer here are whether we are CPU or GPU bound and if GPU bound is it due to the vertex or pixel processing. This will help us to decide how to begin optimising. For example, if we discover that we are fill-rate limited then this could be caused by overdraw (drawing the same pixels over and over) or by expensive pixel shader code and we can modify the optimisation approach accordingly. Once we solve the issue the next step would be to discover the new bottleneck and solve for that and then keep iterating until we have found an acceptable performance level. There is a large element of trial and error and detective work involved in this process. Let’s look at some of the tools which will provide more in-depth information about how our program is affecting both the CPU and GPU.
Unity Profiler & Visual Studio Graphics Debugger
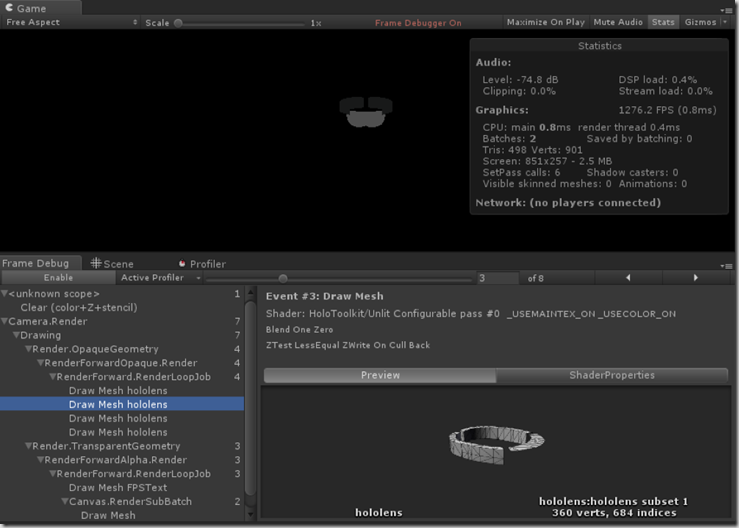
There is an excellent guide for the Unity profiler here and I can’t add much here but it’s worth mentioning that your profiling sessions can all be executed remotely on a HoloLens device and should be done in a release build. Unity also has a frame debugger so you can step through and observe the contents of the frame buffer on each call.
I had a preference for the Visual Studio Graphics Debugger Tools as I have used them previously and I suffered a few niggles with the Unity UI for their tools. Here’s the equivalent getting started guide.
Meshes
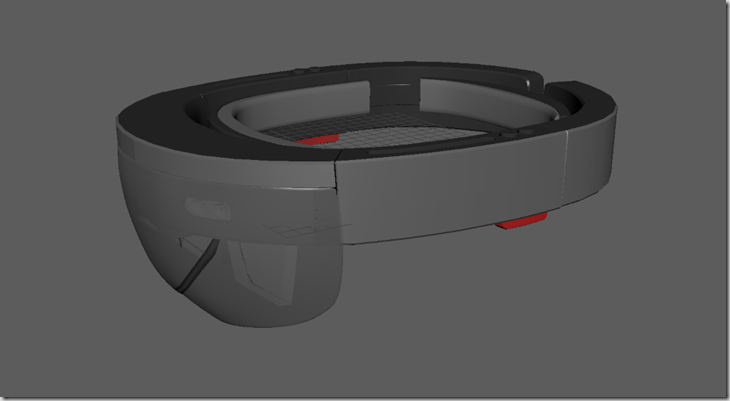
When picking up projects involving 3D models it can often be the case that models already exist in one form or another but they may be too complex or may exist in a form that is inefficient to render on a HoloLens device. Some examples of this might be retargeting from a VR app which may have run on a powerful gaming rig, using CAD data which may be stored as dense meshes and using photogrammetry or scanning which can often result in high polygon-count 3d models. Let’s go through a very simple example, taking a 3D model of a HoloLens and reducing it’s complexity to allow it to be used to represent head positions of users in a multi-lens experience:
This model is approx 13.5k triangles so we’d like to get that down a bit. Here are the techniques I used to reduce the size of this model:
First, simply opening it in some 3D modelling software and removing large bulk items which weren’t necessary like the headband section, etc.
Next, some cleaning by hand in Maya using some of the mesh tools there to cleanup things like vertices that are very close together
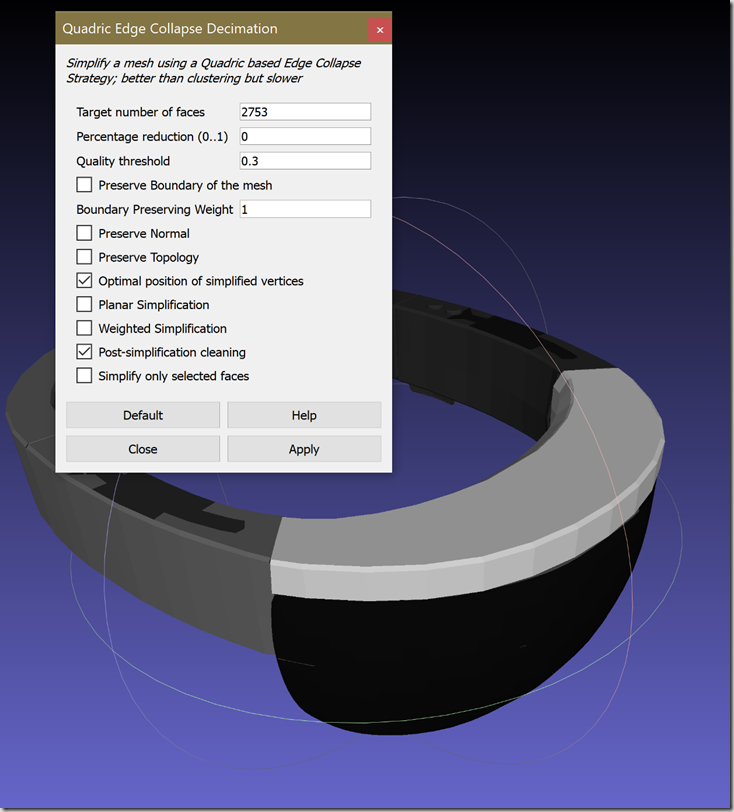
Finally, opening the model in MeshLab and running the Quadric Edge Collapse Decimation filter (this required some trial and error until a model with decent shape and acceptable poly count was achieved)
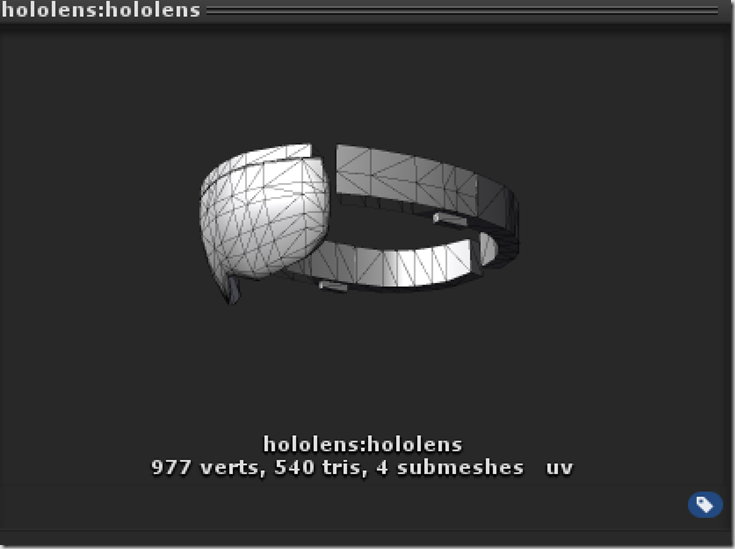
Here’s the final model:
Minimising Transforms
Just a quick note on this which is that unnecessarily deep transform hierarchies will have an effect on performance which can be avoided. If you find yourself inserting empty game objects to undo transforms which have been frozen into the object as a result of its import to Unity it might be worthwhile going back to the authoring process and freeze all of the transformations before importing. Starting with pivots at the centre of objects will avoid any unexpected transformation anomalies later.
Batching
It is worth understanding the way that Unity seeks to minimise state changes on the GPU. GPU state changes have traditionally been expensive and a criteria around which rendering order can be organised to maximise rendering performance. Unity calls this batching and uses the terminology SetPass call for a call where the state is changed. You can get some information from the statistics view on the game preview window about this such as number of SetPass calls and number of batches. Static meshes that share the same material will get batched together and to some degree dynamic meshes will too but there is a set of criteria for this.
Occlusion + Frustum Culling
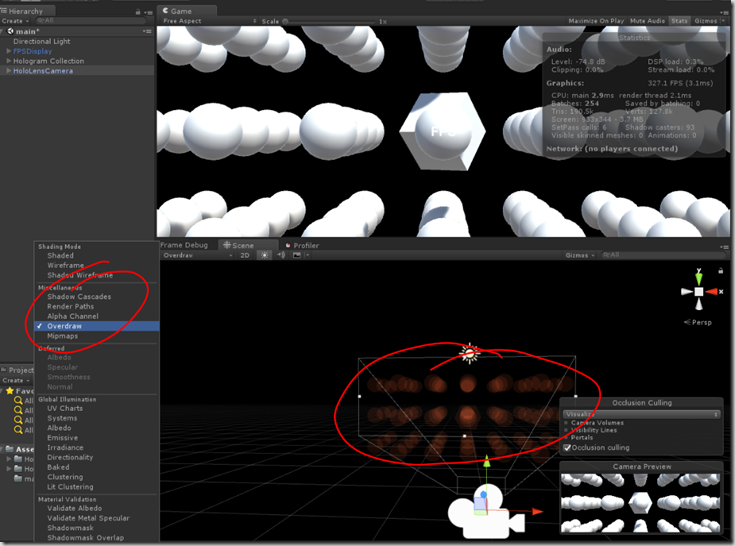
Frustum culling is an optimisation used to reduce the number of vertices that are processed per frame and for a lot of common HoloLens scenarios it may not be that useful. The majority of HoloLens apps I see don’t involve rendering large environments which may cover the whole holographic frame – this would often be more useful in a virtual reality device but the HoloLens is flexible in that regard and sometimes you may need both scenarios. I worked recently on an app which needed to render a VR-like large environment but then as a real environment got built it acted more as a mixed reality device – augmenting the real buildings with digital content. Frustum culling works on static meshes by working out which meshes in your scene lie outside the camera frustum, and thus won’t be visible, and ignore them from the render. If your app happens to place the HoloLens view inside a huge scene, say a maze or a whole street and you are inside one of the spaces within like a house you can avoid rendering the rest of the houses on the street and it is great that this happens by default as it saves you some work. Even though Unity carries out Frustum culling by default but it’s always good to understand what is happening in your scene and we can set up Unity to give a visualisation of what is happening. Now occlusion culling will discount objects from the render that are occluded by others in the scene and this requires a little bit more setup but not much! The first thing worth noting is that, like a lot of trade-offs in computing there is a balance between memory usage and runtime performance. To explain, the data required for occlusion culling is ‘baked’ into a file offline and that data is then used at runtime to determine which objects to ignore from the render. To understand whether it is a worthwhile consideration for your app you can try to understand how much overdraw actually exists at specific views in your scene. A handy way to visualise this is by switching on the overdraw render option in Unity’s scene view:
Just to explain this a little; I have created a project which contains a 3d grid of spheres in order to demonstrate some of the different culling options and when switching on overdraw we get a visualisation of how many times each pixel is being rendered using different levels of transparency. The more opaque blobs at the centre of the camera frustum indicate the most overdraw. Let’s step through how to enable occlusion culling:
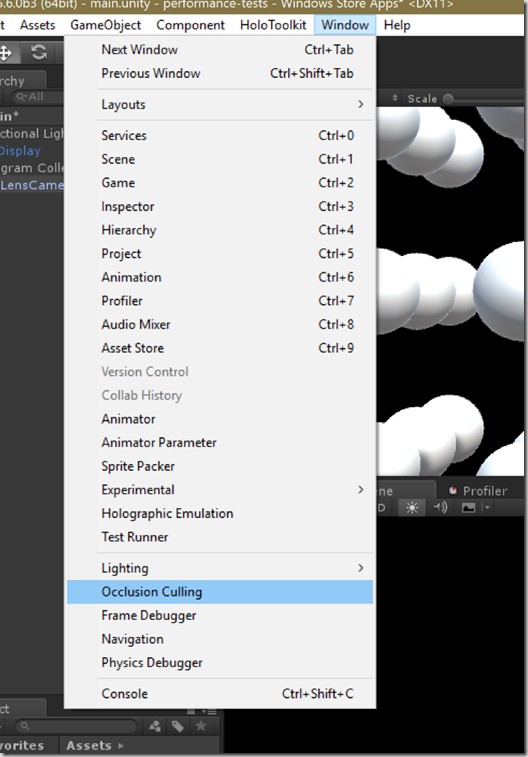
To activate choose Window > Occlusion Culling
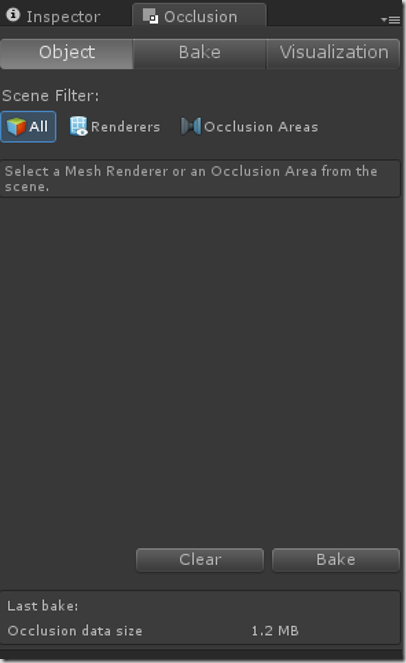
You will then be able to access the occlusion window which looks like this:
I left the default settings for this window and haven’t experimented with Occlusion Areas yet. You can adjust the Bake parameters which let you determine the resolution of the space partitioning used for the culling with smaller partitioning resulting in larger bake file sizes. Pressing Bake will update the calculations and store them to disk with the data size shown at the bottom. Using the same scene as before for the screencast below will illustrate frustum and occlusion culling using the visualisation panel.
Single-Pass Instanced Rendering Mode
Instead of rendering each eye separately, this uses a wider render target and alternating draw calls to render both eyes with a single scene traversal. Option in Player Settings.
Note that some shaders might need to be updated to work with it.
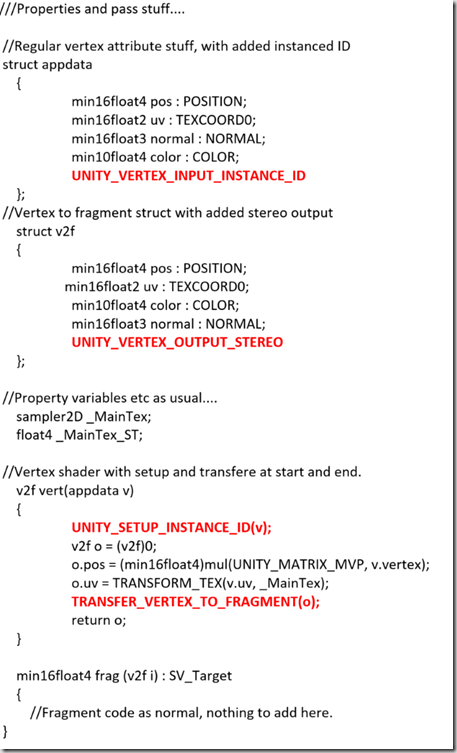
I believe that the HoloToolkit shaders have been updated to accommodate but if you use this mode and you see things unexpectedly render in one eye only then you might need to check the shader code and add something like the following.
Some info on GPU instancing here https://docs.unity3d.com/Manual/GPUInstancing.html
This tells the vertex shader about the render target index, which will transform the vertices correctly into both eyes, and then render them to the correct render target ID (HoloLens render targets are stored in an array of 2 render targets, so its basically going renderTo>>RenderTextureArray[EyeID])
Optimised shaders
If you suspect from your profiling that you might be fill-rate limited – you could test this theory by using a pixel shader that doesn’t do any calculations and check the performance of your app – then consider optimising your shaders. The HoloToolkit contains some optimised shaders which you can either use as is or use as a basis on which to build more specific shaders.
.


Comments